
INTRODUCTION TO RESEARCH
Concept of Research
The Importance of Research in Daily Life
Assess the importance of research in daily life
Knowledge
generated by research is the basis of sustainable development, which
requires that knowledge be placed at the service of development, be
converted into applications, and be shared to ensure widespread
benefits. Some benefits of research include the following:
- Research is essential to economic and social development of our globalized society. For example, research can lead to improvement in the quality of life when, for instance, the findings show that fast population growth does not match the government’s efforts to provide comprehensive social services such water supply, health and education. In this case, family planning methods can be used to check population growth.
- Research enables the development of knowledge or generation of a new knowledge. For example, a researcher can establish the reason why malaria cases are on the increase despite supply of mosquito nets to every household. The information obtained can be used to tackle the problem in a different approach rather than insistence on the use of nets.
- Research can be used to test viabilities of theories and possibly develop new theories and laws.
- Knowledge generated from research can improve farming schemes or any other aspect related to life.
States of Research Work
Research Stages in Conducting a Research
Describe research stages in conducting a research
Scientific
research involves a systematic process that focuses on being objective
and gathering a multitude of information for analysis so that the
researcher can come to a conclusion. In this process, the study is
documented in such a way that another individual can conduct the same
study again. This is referred to as replicating the study.
Any
research done without documenting the study so that others can review
the process and results is not an investigation using the scientific
research process. The scientific research process is a multiple-step
process where the steps are interlinked with the other steps in the
process. If changes are made in one step of the process, the researcher
must review all the other steps to ensure that the changes are reflected
throughout the process. The stages or steps of research are explained
below:
1. Problem identification
The
first stage of research work is to identify a problem or develop a
research question. The research problem may be something the researcher
identifies as a problem. This serves as the focus of the study.
A
research problem is a definite or clear statement about an area of
concern, a condition to be improved upon, a difficulty to be eliminated,
or a troubling question which should be answered through data
collection and analysis. A research problem does not state how to do
something, offer a vague or broad proposition, or present a value
question.
The purpose of a problem statement is to:
- introduce the reader to the importance of the topic being studied. The reader is oriented to the significance of the study and the research questions, hypotheses, or assumptions to follow;
- place the topic into a particular context that defines the parameters of what is to be investigated; and
- provide the framework for reporting the results and indicate what is probably necessary to conduct the study and explain how the findings will present this information.
The
problem to be studied must be clear, accurate and meaningful. In
identifying the problem, two basic steps explained below are followed:
- Identifying the problem which is related to the subject of interest such as soil erosion, agriculture, climate, weather, etc. In agriculture, for example, the problem can be “Do mining activities pollute water sources in Tarime District?”
- Narrowing down the problem so as to make it specific and easy to answer through data collection. For example, “Do mining activities like those undertaken in Nyamongo Gold Mine pollute water sources such as River Tigite in Tarime District?”
The
information of a problem provides the context or scope and framework
for the study. Sources of a problem include personal experiences,
conclusions from theories, literature reviews, practical issues,
deductive reasoning and inductive reasoning.
A
research problem must be researchable or verifiable (both theoretically
and practically), clear and ethical. The research contains variables. A
variable is a factor or characteristic that a researcher would like to
handle, measure, observe or manipulate in the research. A researcher
must determine which variable needs to be manipulated to generate
quantifiable results.
The
key to designing any experiment is to look at what research variables
could affect the outcome. There are many types of variable but the most
important, for the vast majority of research methods, are the
independent and dependent variables.
The independent variable is
also known as the manipulated variable, is the factor manipulated by
the researcher, and it produces one or more results, known as dependent
variables. An independent variable is the one whose effect the
researcher would like to establish in a study. The variable is used to
ascertain whether or not the result one gets is due to it.
Any
factor that can take on different values in an experiment is a
scientific variable. For example, in an experiment investigating the
effect farmers’ level of education on environmental degradation, the
variables might be farmer’s age, level farmer’s of education, number of
training the farmer has attended, the number of times the farmer has
been visited and advised by agricultural or environmental officers,
farmer’s gender, etc.
In
an experiment, the independent variable is manipulated and the effects
observed. These observed effects are called dependent variables. They
are often the hypothesized outcome of manipulating the independent
variable. A dependent variable, therefore, is a change or outcome which occurs as a result of the independent variable.
A
change in the dependent variable depends on the independent variable,
hence the name. The dependent variable responds to the independent
variable, and it’s this relationship that researchers attempt to measure
when conducting experiments. For example, a researcher might wish to
establish the effect of fertilizer on the rate of plant growth; amount
of fertilizer is the independent variable. The researcher could regard
growth as height, weight, number of fruits produced, or all of these.
These are dependent variables because they depend on the amount (or
type) of fertilizer applied. A whole range of dependent variables arises
from one independent variable.
2. Literature review
Now
that the problem has been identified, the researcher must learn more
about the topic under investigation. To do this, the researcher must
review the literature related to the research problem. This stage
provides foundational knowledge about the problem area. The review of
literature also educates the researcher about what studies have been
conducted in the past, how these studies were conducted, and the
conclusions in the problem area.
Literature
review involves collection of ideas and information presented by
different scholars in books, journals, or reports. This stage guides a
researcher to do a research on what other researchers have not gone
through so as to avoid repetition. It also helps a researcher find out
more information about the problem at hand. For example, in the study of
the effects of education level on the rate of environmental
degradation, the researcher can go through books, journals, or reports
to find out what other researchers say or recommend about this study,
usually by focusing on the study in question.
3. Formulation of hypothesis
A
hypothesis is a tentative, testable answer to a scientific question.
Once a scientist has a scientific question she is interested in, the
scientist reads up to find out what is already known on the topic. Then
she uses that information to form a tentative answer to her scientific
question. Sometimes people refer to the tentative answer as "an educated
guess." Keep in mind, though, that the hypothesis also has to be
testable since the next step is to do an experiment to determine whether
or not the hypothesis is right.
If one’s interest is to test “the effect high population growth on deforestation”, she may state the hypothesis as “Fast population growth accelerates deforestation”.
A
hypothesis leads to one or more predictions that can be tested by
experimenting. A hypothesis is tested by drawing conclusions from it. If
observation and experimentation show a conclusion to be false, the
hypothesis must be false. For example, it may be assumed that the
problem of environmental degradation through agriculture is due to lack
of education among farmers. A research can be conducted by interviewing
sample farmers about their level of education and whether or not they
are receiving the necessary training on environmental pollution. If the
collected data confirms the case to be true, then the hypothesis is
true. If not true, the hypothesis is wrong.
It
is important to note that a good hypothesis is one which is simple,
clear but not obvious; precise, testable, and able to indicate the
relationship between variables.
4. Establishment of a study design
This
involves the people who will participate in the research study,
specifying who will participate in the study; how, when, and where data
will be collected. It also focuses on how best the data will be
collected and the tools that will be used. This requires the researcher
to know the kind of information needed, who has the information and
where to find the respondents.
The
people whom the researcher intends to get the information from or the
number of individuals to be experimented upon are called the population.
For example if the researcher wants to find out about the effect of
local seeds on crop yields in Tarime District, the possible population
will be peasants in selected wards or villages of the named district.
The farmers in selected wards or villages represent want we call target population.
This is because it is difficult to research all farmers in the
district, in which case a representative population is selected
randomly. However, due to one reason or another, not all the target
population can be reached. This makes the researcher select the accessible population out of the target population, that is, the population that can be reached easily.
Another
difficulty often arises that not all members in the target population
can participate. The researcher, therefore, should select even a smaller
population to deal with. The process of selecting the participants
(respondents) is called sampling and the sampled out population is
called sample population or sample size. For example,
if the target population consists of 500 peasants, a research may select
just 200 peasants to participate in the study. This is the sample
population or sample size. The reason behind sampling is that it is
impossible to reach everyone in the population due to several
limitations such as time and financial constraints, long distances or
remoteness, human factor, etc.
The
use of samples assumes that the sample is a representative of the
population. All members are given an equal and independent chance to be
selected through application of different sampling techniques (which are
beyond the scope of this study).
5. Reconnaissance
This
is a pilot study which is conducted in the study area before the actual
data collection is done. The researcher subjects to testing a small
area with equivalent features needed for research, especially the tools
of research before the actual study is conducted. Thereafter, the actual
data collection is conducted after ensuring that tools are in the best
condition to bring the expected results.
6. Data collection
Once
the reconnaissance is completed, the actual study begins with the
collection of data. The collection of data is a critical step in
providing the information needed to answer the research question. Every
study includes the collection of some type of data—whether it is from
the literature or from subjects—to answer the research question. Data
can be collected in the form of words on a survey (interview), with a
questionnaire, through observations, or from the literature. These
methods of data collection, also called research instruments or research
tools, are discussed below:
(a) Observation
Observation
is a way of gathering data by watching behaviour, events, or noting
physical characteristics in their natural setting. Observations can be
overt (everyone knows they are being observed) or covert (no one knows
they are being observed and the observer is concealed). The benefit of
covert observation is that people are more likely to behave naturally if
they do not know they are being observed. However, you will typically
need to conduct overt observations because of ethical problems related
to concealing your observation.
Observations
can also be either direct or indirect. Direct observation is when you
watch interactions, processes, or behaviours as they occur; for example,
observing a teacher teaching a lesson to determine whether she/he is
delivering it with fidelity. Indirect observations are when you watch
the results of interactions, processes, or behaviours; for example,
measuring the amount of food waste left by students in a school
cafeteria to determine whether a new food is acceptable to them.
Observation
is most commonly used in qualitative research. There are two types of
observations namely, unstructured and structured observation.
- Unstructured observation is a type observation where there is no checklist (a list of items to be noted, checked, or remembered) so all behaviours seen are written down in as much detail as possible.
- Structured observation is a type observation that involves the recording of events of predefined types occurring at particular points in time, or within particular intervals. Structured observation typically produces quantitative data (information about the frequency of different sorts of events or of the proportion of time spent on different types of activity).
Advantages of observation
- Data is collected where and when an event or activity is occurring.
- It does not rely on people’s willingness or ability to provide information. This is because people are not always willing to write their true views on a questionnaire or tell a stranger what they really think at interview.
- It allows the researcher to directly see what people do rather than relying on what people say they did.
- It is the only appropriate tool for certain cases. For example, in the case of animals, infants, deaf and dumb persons, mad persons, non-cooperative persons, too shy persons and for persons who do not understand the language of researcher, observation will be the only appropriate tool.
Disadvantages of observation
- It is susceptible to observer bias.
- It is susceptible to the “hawthorne effect,” that is, people usually perform better when they know they are being observed, although indirect observation may decrease this problem.
- It can be expensive and time-consuming compared to other data collection methods.
- It does not increase researcher’s understanding of why people behave as they do.
- Some of the occurrences, such as sexual activities by couples, may not be open to observation.
- Not all occurrences open to observation can be observed when observer is at hand. For example, the quarrel and fight between two individuals or groups is never certain. Nobody knows when such an event will take place.
- Not all occurrences lend themselves to observational study: For example, love, affection, feeling and emotion of parents towards their children are not open to our senses and also cannot be quantified by observational techniques. The researcher may employ other methods like case study; interview etc. to study such phenomena.
(b) Interview
Interviewing
is one of the most common methods of collecting information from
individuals. The technique involves oral or vocal questioning or
discussion. It often involves two people – the researcher (interviewer)
and the respondent (interviewee). The interviewer asks questions or
initiates the discussion while the interviewee answers the questions or
responds to the discussion.
There
are various types of interviews that are used to collect data. These
include structured, semi-structured and unstructured interviews.
Structured interviews:
These are more or less like questionnaires since they consist of closed
ended items. In this kind of interview, the respondents must choose
from a limited number of answers that have been written in advance.
Example 1
The following are examples of structured interview questions:
- Which human activity do you think pollutes the environment a great deal? [Tick your choice] (A)Agriculture (B) Mining (C) Transportation.
- Do you think family planning controls population growth? YES/NO; TRUE/FALSE; etc.
Semi-structured interviews:
These are flexible kind of interviews in which the interviewer asks
important questions in the same way each time but is free to alter the
sequence of the questions and to probe for more information. Some items
are structured while others are open. The respondents are free to answer
the questions in any way they choose.
Example 2
Examples
of semi-structured interview questions: (1). How do you dispose off the
kitchen waste? (2). For how long have you been cultivating your land
with a tractor?
Unstructured interviews:
These are wholly open ended instrument in which interviewers have a
list of topics they want respondents to talk about but are free to
phrase the questions as they wish. The respondents are free to answer in
any way they choose.
Example 3
Examples
of unstructured interview questions: (1). Why do you think it is
important to boil and filter drinking water? (2). In your own views,
what should be done to improve agricultural production in the country?
Interviews
can be conducted in a variety of ways; for example, by telephone or as a
face-to-face interview using an interview schedule to guide your
questions. Usually, combinations of structured, semi-structured and
unstructured interview questions are used to collect data. It is
important to do so in order to capture as much data as possible.
Interview
is one of the best methods of data collection. However, language
barriers, biasness, shyness and discomfort may prevent the researcher to
get the intended information.
Advantages of interviews
- They are useful to obtain detailed information about personal feelings, perceptions and opinions.
- They allow more detailed questions to be asked.
- They usually achieve a high response rate.
- Respondents' own words are recorded.
- Ambiguities can be clarified and incomplete answers followed up.
- Precise wording can be tailored (modified) to the respondent and precise meanings of questions clarified.
- Interviewees are not influenced by others in the group.
- Some interviewees may be less self-conscious in a one-to-one situation.
Disadvantages of interviews
- They can be very time-consuming in terms of setting up, interviewing, recording, analysing, feedback, and reporting.
- They can be costly.
- Different interviewers may understand and record interviews in different ways.
(c) Questionnaire
A
questionnaire is a research instrument consisting of a series of
questions for the purpose of gathering information from respondents.
This is the most common type of research instrument. It involves the use
of written down items to which the respondent individually responds in
writing. The items are in the form of questions or statements.
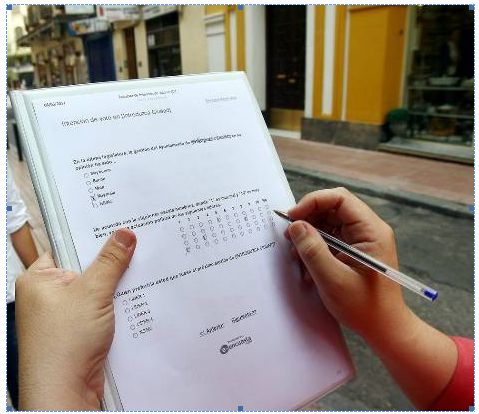
Fig 1.1 A respondent filling a questionnaire
Although questionnaires are often designed for statistical analysis of the responses, this is not always the case.
Questionnaires
have advantages over some other types of surveys in that they are
cheap, do not require as much effort from the questioner as verbal or
telephone surveys, and often have standardized answers that make it
simple to compile data. However, such standardized answers may frustrate
users. Questionnaires are also sharply limited by the fact that
respondents must be able to read the questions and respond to them.
Thus, for some groups of people, conducting a survey by questionnaire
may not be concrete.
It
is important that the questions and statements for each item are clear,
easy to read and interpret by the interviewee. Each item should contain
one idea. Avoid long, complicated and ambiguous statements.
The
use of a questionnaire in data collection is advantageous because there
is a possibility of reaching distant respondents; it has well-planed
questions as they are prepared and tested beforehand and can always be
modified and adapted. This technique however is costly. Also, there is
possibility of loss of material on transit, late filling and returning
of the questionnaires and illiteracy as a barrier.
Advantages of a questionnaire
- It is a relatively simple method of obtaining data.
- Less time is consumed.
- Researcher is able to gather data from a widely scattered sample.
- It is suitable for distant respondents.
Disadvantages of a questionnaire
- Responses to a questionnaire lack depth.
- Respondents may omit or disregard any item they choose.
- Some items may force the respondents to select responses that are not their actual choices
- Length of the questionnaire is limited according to the respondent’s interest.
- Printing may be costly especially if it is lengthy.
- Data are limited to the information that is voluntarily supplied by the respondents.
- Some items may be misunderstood, especially where clarity is not observed.
- The sample is limited to those who are literate.
- Questionnaires may either get lost on the way or some pages detached.
7. Data analysis
Data
analysis, also known as analysis of data or data analytics, is a
process of inspecting, cleansing, transforming, and modelling data with
the goal of discovering useful information, suggesting conclusions, and
supporting decision-making. It is a messy, ambiguous, time-consuming,
creative, and fascinating process.
The
researcher has to analyze the data so that the research question can be
answered. The results of this analysis are then reviewed and summarized
in a manner directly related to the research questions. The stage
involves some mathematics, description, organization and interpretation.
A
researcher produces data of various kinds such as crop yields, people’s
behaviour, farming systems, level of poverty in the rural community,
etc. The analysis of this data should be well organized to make sense.
The
purpose of analysing data is to obtain usable and useful information.
The analysis, irrespective of whether the data is qualitative or
quantitative, may:
- describe and summarise the data;
- identify relationships between variables;
- compare variables;
- identify the difference between variables; or
- forecast outcomes.
Scales of measurement
People
are often confused about what type of analysis to use on a set of data
and the relevant forms of pictorial presentation or data display. The
decision is based on the scale of measurement of the data. These scales
are nominal, ordinal, interval, and ratio.
Nominal
Let’s
start with the easiest one to understand. Nominal scales are used for
labelling variables, without any quantitative value. “Nominal” scales
could simply be called “labels.” Notice that all of these scales are
mutually exclusive (no overlap) and none of them has any numerical
significance. A good way to remember all of this is that “nominal”
sounds a lot like “name” and nominal scales are kind of like “names” or
labels.
Examples of nominal scale are given in the chart below.
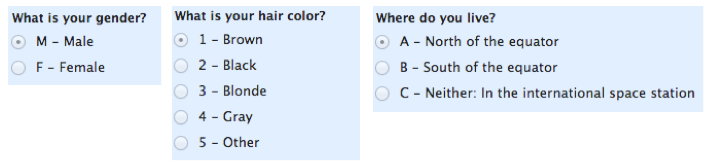
Note: a sub-type of nominal scale with only two categories (e.g. male/female) is called “dichotomous.”
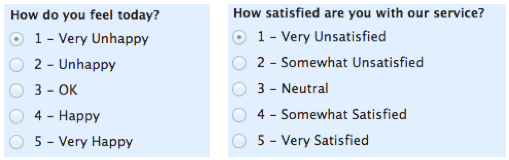
Ordinal
With
ordinal scales, it is the order of the values that is important and
significant, but the differences between each one is not really known.
Take a look at the example below. In each case, we know that a number 4
is better than a number 3 or number 2, but we don’t know–and cannot
quantify–how much better it is. For example, is the difference between
“OK” and “Unhappy” the same as the difference between “Very Happy” and
“Happy?” We can’t say.
Ordinal scales are typically measures of non-numeric concepts like satisfaction, happiness, discomfort, etc.
“Ordinal”
is easy to remember because is sounds like “order” and that’s the key
to remember with “ordinal scales”–it is the order that matters, but
that’s all you really get from these.
The
best way to determine central tendency on a set of ordinal data is to
use the mode or median; the mean cannot be defined from an ordinal set.
Examples of ordinal scale are given in the chart below.
Interval
Interval
scales are numeric scales in which we know not only the order, but also
the exact differences between the values. The classic example of an
interval scale is Celsius temperature because the difference between
each value is the same. For example, the difference between 60 and 50
degrees is a measurable 10 degrees, as is the difference between 80 and
70 degrees. Time is another good example of an interval scale in which
the increments are known, consistent, and measurable.
The central tendency in interval data can be measured by mode, median, or mean; standard deviation can also be calculated.
Ratio
This
is a type of scale that is used to make comparisons between values or
quantities. For example, Wangwe harvested 50 sacks of maize which is
twice the quantity harvested by Wambura from the same acreage because
the former applied fertilizer and good farming practices while the
latter did not. This gives a ratio is of 50:25 = 2:1.
8. Data interpretation
This
is a stage at which data is organized, and assembled to permit drawing
of conclusion and actions. Data interpretation is part of daily life for
most people. Interpretation is the process of making sense of numerical
data that has been collected, analyzed, and presented.
Assume
a research was conducted to find out the rate (weigh per plant) at
which a new fertilizer, X, can be applied to get the maximum yield of
maize. The results obtained were tabulated as follows:
Table 1.1 Rate of application of fertilizer X versus yield (hypothetical data)
| Fertilizer rate (g/plant) | 0.25 | 0.50 | 0.75 | 1.00 | 1.25 | 1.5 | 1.75 | 2.00 | 2.25 | 2.50 | 2.75 | 3.00 |
| Harvest (tonnes/per hectare) | 20 | 24 | 25.4 | 35.2 | 40.9 | 65 | 76.5 | 80.3 | 79.0 | 78.6 | 77.1 | 76.2 |
The
data shows that any increase in fertilizer from 0.25 grams to 2.00
grams leads to an increase in yield. The maximum yield is attained at an
application rate of about 2.00 g of fertilizer per plant. However,
beyond this fertilizer rate, any added input (fertilizer) leads to a
decreasing output (maize). This means that, to get maximum yield,
fertilizer application should not exceed 2.00 grams per plant, possibly
because too much fertilizer is toxic to plants.
9. Testing hypothesis
After
data presentation, the researcher is able to answer questions asked in
each step during data analysis. This is done through hypothesis testing
where the question statement is proved or disproved.
10. Report wring/presentation
Research
report is a condensed form or brief description of the research work
done by the researcher. This is the last stage of research where a
researcher communicates his/her findings to the public or other
researchers.
Report writing in research is very important because of the following reasons:
- It reveals the researched problems and their implications.
- It fully represents the outcomes of the research data.
- It interprets the data.
- It provides the data around the problem.
The report format
As
you read through the large number of published studies, you will likely
notice that the reports tend to follow both a topical pattern and a
style of writing. Normally, research a reports have three main parts –
preliminary pages, main body of the report, and conclusion and
recommendations.
(a) Preliminary pages
These pages serve as a guide to the leader. Page one carries the title of the research. An example of a research title is: “An assessment of the factors affecting oil palm production in Kigoma region”.
Page
two carries declaration. This is an oath and confirmation that the work
belongs to the named researcher and that it has not been produced by
any researcher before.
Page
3 contains an acknowledgement. Here the researcher thanks people who,
in one way or another, assisted him/her to accomplish his/her research
work.
The next page contains a table of contents, followed by the page carrying the list of tables (if any).
Thereafter,
the list of diagrams or figures (if any) follows. Next to the list of
figures is the abstract. The abstract summarizes the outcome of the
research in a few words.
(b) The main body
The chapters contained in the main body of the research report include the following:
Chapter 1: Introduction
The
main body of the paper has five chapters, with the introduction being
the first. The purpose of the introduction is to introduce the reader to
the topic and discuss the background of the problem at hand. The
chapter consists of the background statements of the problems, the
purpose and objectives of study, scope of the study and significance of
the study.
Chapter 2: Literature review
This
chapter contains a review on what other readers and scholars have
reported about the problem under investigation. For example, if the
research investigates about the reason for a drop in maize production in
the study area, then the literatures reviewed should talk about maize
production. The information reviewed could include land preparation,
planting, harvesting, yield and any other relevant information.
Chapter 3: Methods
Methods
refer to the actual procedures used to perform the research. The
methods section is often the most systematic section in that small
details are typically included in order to help others analyse,
evaluate, and/or replicate the research process if desired.
The
chapter explains about the methods used to collect, handle and analyse
data and the model of data analysis used. It also includes an
explanation about the study area, research design, population and
sampling, survey instruments used, and objectives of the study.
The
methods of investigation described in this chapter include where, by
whom and how the study was conducted in a named study area. It also
discusses about sample population and how it was sampled, location of
the study area and other demographic characteristics such as sex, age,
and socio-economic status of the population under study.
The
procedures used to collect data spells out the actual steps taken to
collect data. It involves mentioning the procedure and problems
encountered during data collection.
Data
analysis is one of the information explained in this chapter. Details
on data treatments and the statistical techniques employed to analyse
data are fully explained.
Limitations that could have influenced the study and were beyond the researcher’s control are also discussed.
Chapter 4: Results
This
chapter shows the results obtained from the research. Results can be
presented in the form of tables, diagrams, charts, figures, lines, etc.
Chapter 5: Discussion
Discussion
of the results is done in this chapter. This section allows the
researcher to scrutinize the research, discuss how the results are
applicable to real life or even how they don’t support the original
theory. The discussion section gives the researcher an opportunity to
discuss, in a less formal manner, the results and implications of the
research.
Chapter 5: Conclusion and recommendations
This
is the final chapter in a research. In this chapter, the researcher
draws his/her conclusion based on what has been observed in the whole
study. The conclusion touches all issues observed from chapter one to
the final chapter. Observations and suggestions from other authors and
researchers can also be included in this chapter.
Recommendations
are often used to suggest the needs for additional research on specific
areas related to the current study. What remains to be done in the
study at hand is also put forward. This gives room to other researchers,
and serves as a starting point, for further studies on the same topic.
The researcher also suggests to the government or any institution on the
best way to tackle the research problem.
After conclusions and recommendations, follows the references and appendices.
Conducting Research
Conduct research
Research
needs to be conducted in a clear and organized manner so as to obtain
answers to the stated problem.The preparation of research proposal
should be done before conducting it. Sometimes it may be hard to get
data from the targeted population. Sampling should be used to obtain a
representative population and save time as well as utilize resources
economically.
The use of Research Output and Recommendations
Explain the use of research output and recommendations
The result obtained from any research is what we call research output.
Ideally, the purpose of conducting any research is to come out with an
output that can be used to solve a given problem, which probably hinders
human development, in one ways or another. Uses of research output and
recommendation include the following:
- Research can improve people’s knowledge, for example, the discovery of a new knowledge in combating mosquitoes that spread malaria.
- Recommendations suggested by researchers can be used by the governments or any institutions to solve the problems inflicting the society such as disease, drought, thuggery, famine and social amenities. Solutions to these problems are obtained by conducting research which comes with suggestions on how to solve them successfully.
- Research results can be used to improve economic activities and community welfare. For example, the discovery of a new variety of maize that resists diseases and produces high yields can make farmers self-sufficient in food. Likewise, discovery of a new breed of cattle which produces more milk can serve a similar purpose.
- Research can lead to sustainable exploitation of natural resources. For example, research on use of improved and energy-serving charcoal burners and kilns has helped reduce the cutting of trees for firewood. Likewise, mining is preceded by exploration and feasibility studies which provide guidelines on how to exploit the minerals sustainably. Establishment of hydroelectric power projects are due to successful research work on the feasibility studies and environmental impact assessment.
- Research findings are useful in formulating government policies. Policies are enacted after a thorough research has been conducted so as to avoid any complaints during implementation.
- Research results are useful in protecting and conserving the environment. For example, a research has been conducted to find out alternative activities for people engaged in charcoal burning for sale. The solution was to introduce dairy goat husbandry as an alternative economic activity to keep people off forests. This has helped to conserve trees and the environment in general.
- Research results can be used to curb unemployment problem. For example, it may be found that the best way to solve unemployment problem is to provide soft loans to youths after graduating instead of just allowing them search for employment opportunities which is very scarce nowadays.
- Research improves the marketability of goods and commodities. Formerly, water sellers used to sell unboiled and unbottled water. After research, it was found that water can be marketed very well if it is purified and bottled.


No comments